|
||||
Output - Interactive Electrical Response Plot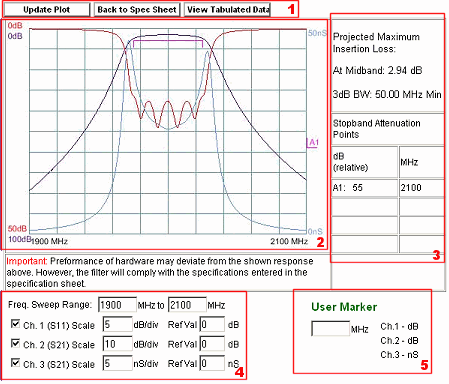
1 - Button BarThe button bar consists of the following buttons
2 - Electrical Response PlotThis is a graphical representation of the filter's electrical response based on the settings in sections 4 and 5. 3 - Insertion loss and Attenuation PointsThis area lists the projected insertion loss and the user supplied attenuation points. 4 - Sweep Range and ScalesThis is where the sweep range and the scales for each channel are set for the plot. The sweep range is set for all the channels but the scale and reference value can be set individually for each channel. Also, by unchecking the check box, the channel can be removed from the plot to be added again by placing a check back in the box. The scale is how many units are between each horizontal line in the plot and the reference value is the value of the unit at the reference line. For channels 1 and 2, the reference is the top most line in the plot. For channel 3, the reference is the bottom most line in the plot. 5 - User MarkerThis allows the user to place a marker on the plot and gives its value at the supplied frequency for each of the three channels. |
||||